Ethereum Price Analysis: Can ETH Bounce Back Before $1.5K Comes Into Play?
Ethereum has rebounded toward $1.82K after a sharp selloff reached the marked liquidity level near $1.71K, with daily momentum showing oversold conditions.
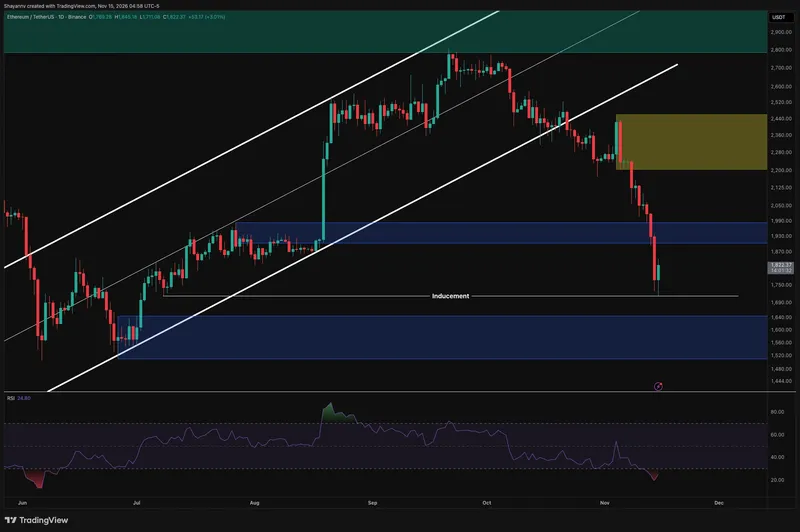
The daily chart shows ETH extending its decline beneath the former $1.90K–$1.98K demand zone. Losing this base accelerated selling toward the horizontal level marked as inducement around $1.71K, where the latest candle has attracted a buying response.
The daily RSI sits near 25, indicating oversold momentum. This supports the possibility of a corrective bounce, particularly after such an aggressive decline, but does not establish a durable bottom. Strong downtrends can remain oversold while price continues lower.
Resistance Levels
The first meaningful recovery hurdle is the broken $1.90K–$1.98K zone, which could now act as resistance. Reclaiming it would ease immediate pressure and improve the prospects of a recovery toward $2.05K–$2.13K. The broader supply zone around $2.20K–$2.46K remains considerably higher.
Downside Risks
If the current rebound fails and ETH breaks sustainably beneath $1.71K, attention would shift toward the major daily demand zone around $1.51K–$1.64K. For now, the reaction from liquidity offers a potential pause in the decline, while a reversal still requires stronger price confirmation.
The four-hour chart highlights persistent bearish momentum following the breakdown beneath the descending channel. Successive consolidation areas have failed to hold, with the latest selloff carrying Ethereum through $1.90K and toward $1.71K before buyers responded.
Whale Activity
Their appearance raises the possibility that large participants are contributing to selling pressure through bearish positioning or hedging. However, order size alone does not reveal trade direction, distinguish opening from closing positions, or confirm accumulation.
The Futures Average Order Size chart shows a recent cluster classified as big whale orders accompanying Ethereum's decline from above $2.2K toward the $1.8K region. This indicates larger average futures trade sizes during the latest phase of weakness.
Related

