Ripple Price Analysis: Is the Worst Yet to Come as XRP Dumps to a 2-Year Low?
XRP has extended its November sell-off, falling more than 10% this week and dropping below the $1.00 mark, testing a key support level.
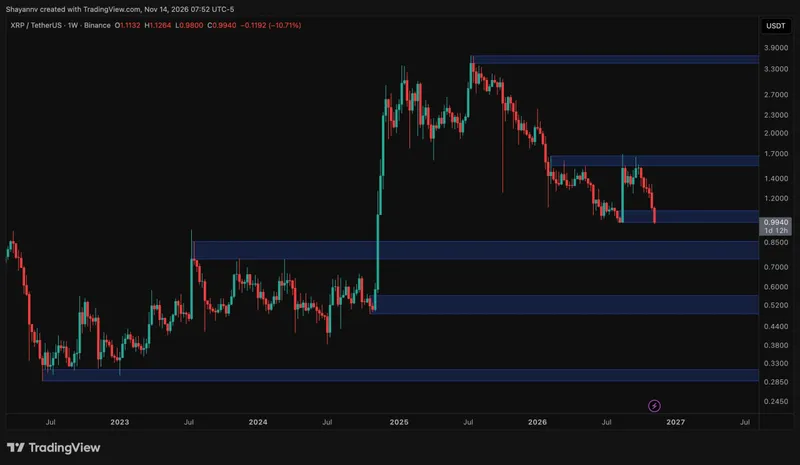
The weekly chart reveals XRP in a broad bearish structure since its peak near $3.65 in July 2025, with clear lower highs and lower lows. The August rally from $1.00 briefly lifted the price to $1.60, but two rejections from that area returned control to sellers, erasing the entire move.
The token is now testing the psychological $1.00 support, which marks both the base of the August rally and the mid-2026 consolidation floor. The current weekly candle has already dipped to approximately $0.965, a two-year low.
Technical Outlook
A decisive weekly close below $1.00 would confirm a breakdown and expose the $0.80 demand zone, which capped price action through 2023-2024. Below that, the $0.50 region could become the next major support level. On the upside, defending $1.00 might support a rebound, but reclaiming $1.60 would be needed to shift the broader structure.
The 4-hour chart shows rapid breakdown after rejection near $1.35 in early November. XRP lost the $1.25 support zone and has printed lower highs and lows since, now trading around $0.98. The RSI shows bullish divergence at 33, suggesting fading bearish momentum, though not confirming reversal.
Next Steps
If buyers hold $1.00, a relief bounce toward $1.07 and potentially $1.13 could follow, with $1.25 acting as resistance. Conversely, a sustained break below $0.98 would invalidate the divergence and bring the weekly $0.80 zone into focus.
Related

