Ethereum Price Predictions: What’s Next for ETH After $2K Fell?
Ethereum has fallen below $2,000 and entered a major daily demand zone near $1,900–$1,980, with persistent bearish structure and nearby liquidation concentrations keeping further downside risk in focus.
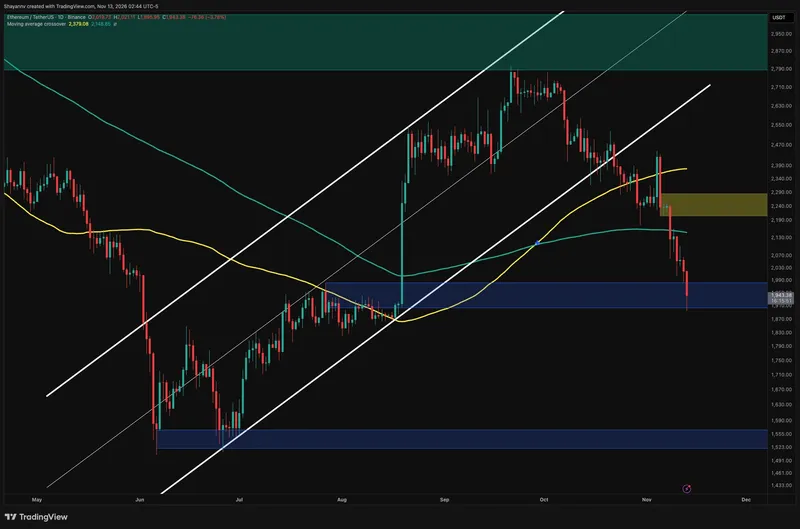
The daily chart shows Ethereum extending its decline after breaking below an ascending channel and failing to sustain subsequent recoveries. The latest selloff has carried the price toward $1,940, with an intraday wick briefly reaching beneath $1,900.
ETH is now testing the $1,900–$1,980 demand zone, which overlaps the consolidation preceding August's strong advance. This provides a meaningful location for buyers to respond, but the current daily candle remains open, and there is no confirmed reversal yet.
Price trades below both displayed moving averages, currently around $2,150 and $2,380. Although their earlier bullish crossover remains visible, the subsequent price breakdown shows that it has not translated into sustained upside momentum. These averages now represent potential recovery hurdles.
Technical Levels
A sustained daily close beneath $1,900 would weaken the demand zone and expose the August consolidation lows around $1,830–$1,870. The deeper marked support lies near $1,520–$1,570. Alternatively, defending demand and reclaiming $2,000 could initiate a recovery, with the $2,200–$2,290 supply zone remaining a substantial overhead barrier.
The four-hour chart highlights an acceleration in selling after Ethereum broke beneath its descending channel's lower boundary. A subsequent rebound toward the $2,040–$2,100 zone failed, reinforcing that area as near-term supply before another bearish expansion pushed ETH below $2,000.
Liquidation Risks
The Binance liquidation heatmap shows a prominent concentration of estimated liquidation exposure beneath the current price, around $1,800–$1,860. This stands out as a relevant downside area if Ethereum fails to hold the daily demand zone.
A move into this concentration could trigger additional long liquidations and amplify volatility. However, the bright band represents potential forced closures rather than confirmed buying support, so reaching it would not necessarily establish a bottom.
Above the market, liquidation concentrations remain around $1,940–$1,980 and farther overhead near $2,100–$2,200. A sustained recovery through $2,000 could bring the higher bands into focus and potentially accelerate a rebound through short liquidations.
Related

